On May 10, 2011, in Metrics, Smaato, by Hugo Candeias
Smaato Inc., the leading mobile ad optimizer and mobile advertisement platform, today released its latest metrics on the global mobile advertising market during the first quarter of 2011. New findings detail the accelerating adoption of mobile advertising, its affect on top mobile ad network performance and considerations for mobile developers and advertisers.
The performance parameters in the Smaato Index are based on 150+ million unique monthly users, 80+billion ad requests in the first quarter of 2011 and over 60 connected ad networks delivering mobile advertising in 220+ countries.
Findings reveal widespread performance difference by top 40 leading ad networks globally as mobile advertising continues to grow exponentially.
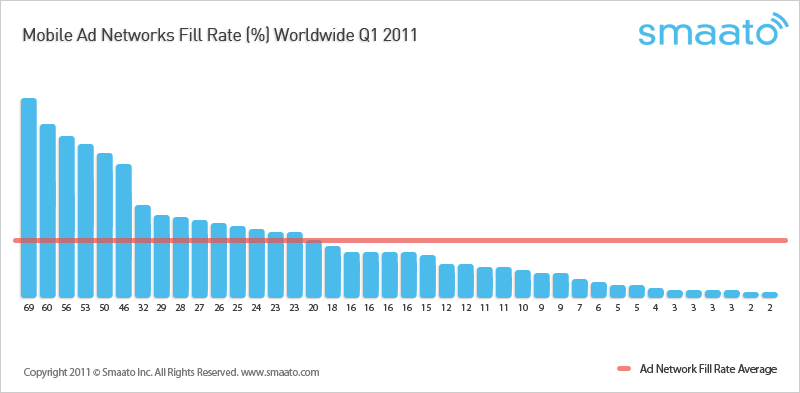
Chart 1: Mobile Ad Networks Fill Rate (%) Worldwide Q1 2011 (click to enlarge)
Fill rate worldwide average drops to 20%
Smaato reports that in Q1 2011, the top 40 ad networks, ranked by ad impression volume, showed a significant performance spread – ranging from 69% to 1% rated by fill rate. The average ad network fill rate was measured at 20%.
Compared to last year’s average fill rate of 28%, as reported by Smaato Q1 2010 Metrics, there are two things to consider:
1) The number of ad networks has increased in Q1 2011 to more than 60 currently connected to the Smaato SOMA platform – as compared to 30 in Q1 2010 and
2) The monthly average ad request volume jumped to 30 billion in Q1 2011 from 6 Billion in April 2010.
Specialized ad networks deliver up to a 69% fill rate
Comparing fill rates if sorted by ad request volumes may offer a better market benchmark in the performance measurement of ad networks, as detailed below in Chart 2. Five mobile ad networks out of the top 40 are performing above the average Smaato Index – between 46% and 69%, though on a comparable smaller volume.
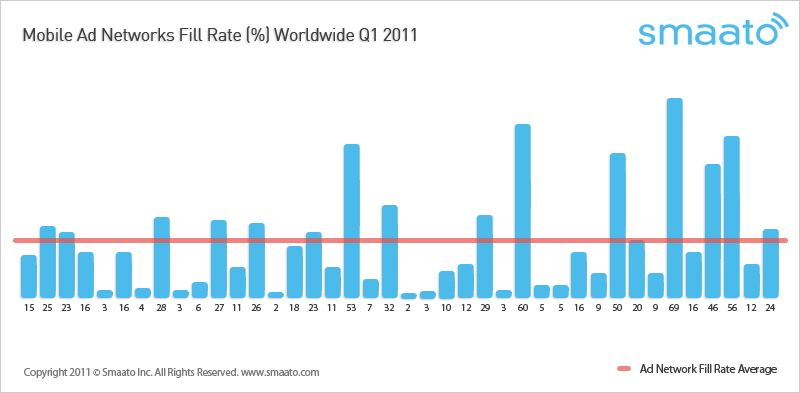
Chart 2: Mobile Ad Networks Fill Rate (%) Worldwide Q1 2011 (click to enlarge)
How to read Chart 2: The ad network with the highest volume of ad requests aggregated in the Smaato network provides an average of 15% fill rate in Q1 of 2011. In comparison, the highest performing ad network with a fill rate of 69% is still performing at a low volume with a rank of 35 out of the top 40 ad networks compared.
From the above findings, the assumption can be made that as the market has grown dramatically in volume – and some ad networks have become more specific in how they are targeting consumers. Ad networks now offer a much more specialized focus such as geo-location targeting, specifically addressing a local market e.g. Japan, or with rich media offerings, such as video. In addition to higher fill rates, this tailored approach tends to also provide higher return for monetization.
What does this mean for app developers?
The process of monetizing mobile advertising is increasingly more fragmented and high fill rates are harder to achieve with only one single ad network. As such, app developers and publishers of mobile websites that seek to monetize their mobile inventory need to enlist multiple ad networks in order to achieve higher fill rates.
Given Smaato’s latest metrics, in order to reach a possible 100% fill rate one would need about five ad network requests simultaneously. This is where ad optimizers such as Smaato come in to aggregate multiple ad networks to maximize the revenue stream through mobile advertising.
In addition, it is worth noting that specialized, small volume ad networks may often times provide a higher price per delivered ad (eCPM or eCPC). As these premium campaigns are often only available for a short time, it is necessary to have a large-scale optimization system in place that track and maximize returns in high volumes of ad requests and fastest response times.
USA shows fill rate average of 23%
In Q1 2011, the top 20 US ad networks (sorted by volume of ad requests) are performing slightly above average at 23%, when compared to the worldwide average of 20%. This performance is based upon a total amount of ad requests of 25+ Billion. Nine out of the top 20 US ad networks performed with a fill rate between 24-56% above average.
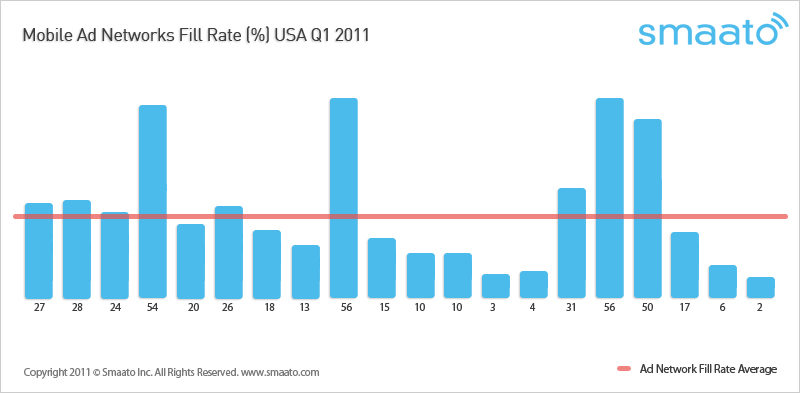
Chart 3: Mobile Ad Networks Fill Rate (%) USA Q1 2011 (click to enlarge)
Chart 3 shows the performance of ad networks that delivered to the US mobile inventory sorted by volume of ad requests. The number one ad network by volume delivered a 27% fill rate in Q1 2011, whereas an ad network with a 56% fill rate ranked at number nine based on volume of ad requests.
Windows Phone leads Smaato Index for Mobile Advertising Performance
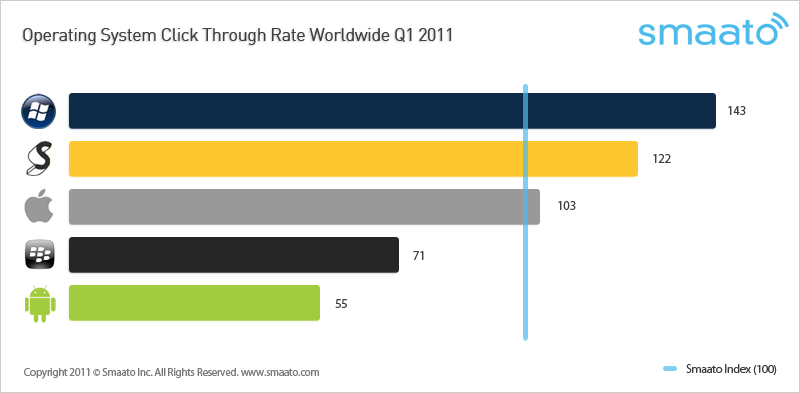
Chart 4: Operating System Click Through Rate Worldwide Q1 2011″ (click to enlarge)
Windows Phone leads the Smaato Index of mobile advertising performance for smartphone operating systems in Q1 2011. This performance benchmark by operation system shows more detailed information on how different operation systems perform compared to their Click Through Rate (CTR). Windows Phone (143) shows a significantly better performance than the average smartphone OS.
Compared to Smaato’s Q3 2010 Metrics, Nokia’s Symbian OS (122) lost its former leading position, now ranked second,with Windows Phone (143) now in the lead. Apple iPhone also remained above the Smaato Index in third position while RIM Blackberry (71) and Google Android (55) remain in the same order at the bottom of the list.
The Index consists of the average CTR of all devices and this number is set to 100.
What does this mean for Advertisers?
Apple iOS and the Android operating system are all over the news as the leading smartphone OS when based on number of apps and number of sold units. However, there is an important factor to consider when planning a mobile ad campaign: performance.
Smaato’s Q1 2011 Metrics report that Windows Phone 7 and Nokia’s Symbian OS rank as the top performing OS in mobile advertising. When a campaign is not only geared towards image and brand visibility, but is measured by click through rates (CTR) and paid in the eCPC model, media agencies are well advised to consider booking their campaigns in the top performing OS as shown by Smaato metrics.
Windows Phone leads USA CTR Index, iOS better than worldwide Index
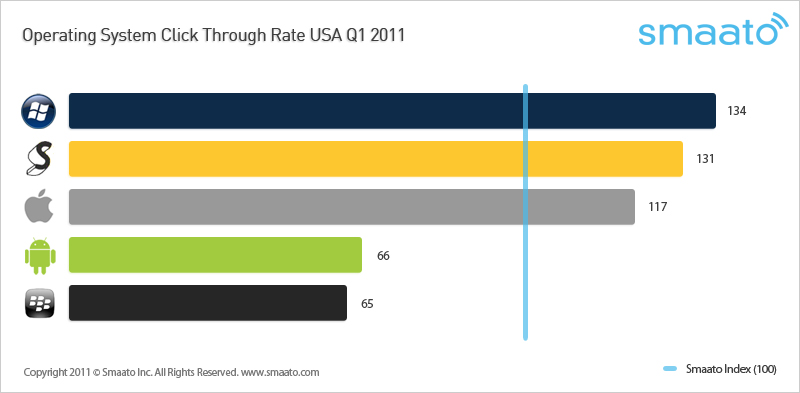
Chart 5: Operating System Click Through Rate USA Q1 2011″ (click to enlarge)
According to Smaato’s Q1 2011 Metrics, Windows Phone (134) also has the leading operating system in the US when ranked by click-through performance (CTR). Symbian (131) still ranks fairly high compared to the popular Apple iOS and Android, while iOS (117) holds its place as the third and last operation system above the Smaato index of 100. In addition, Google Android (66) is performing better in the US market compared to its worldwide performance, while RIM Blackberry (65) is trailing behind the performance ranking of smartphone OS in relation to mobile advertising.
Average response time of mobile ad networks 233 msec worldwide
In Q1 2011, the range of response time ranged from 32 and 272 msec for the top ten worldwide ad networks, adding up to an average response time of 223msec.
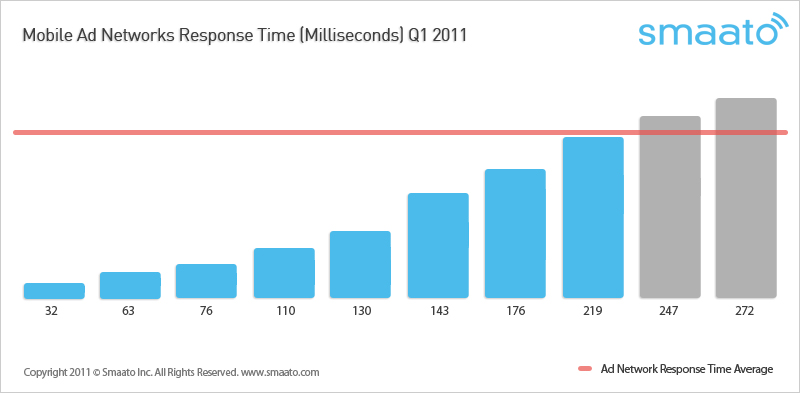
Chart 6: Mobile Ad Networks Response Time (Milliseconds) Q1 2011″ (click to enlarge)
Smaato’s Q1 2011 Metrics demonstrate the performance of mobile ad networks globally. The fill rate is measured as the percentage of ads delivered per ad request and varies by factors such as country, device and content type.
The ad networks are not named in the Smaato metrics, but are revealed in the dashboard of registered Smaato publishers reporting and analytics tools available here.
http://www.smaato.com/metricsq12011/
'IT leads the change > Smart Device (스마트기기)' 카테고리의 다른 글
| 애플의 모바일광고 비밀전략 (0) | 2011.07.05 |
|---|---|
| Which Mobile Advertising Platform Is the Best? (0) | 2011.07.05 |
| Fastest Internet Speeds by Country Q4 2010 (0) | 2011.07.05 |
| '아이폰5' 언제 출시되나 루머 난무···진상은 (0) | 2011.07.04 |
| 외신 '아이패드3-아이폰5 10월에 출시' (0) | 2011.07.04 |